The original thought and observation ↩
While I'd love to assume you read my previous blog post, you might just be interested in this post because it promises a bit of optimization and data structure tomfoolery, and that's worth it for sure. But let me give you a bit of context.
While working on a sublimetext plugin to more easily convert local file paths into paths on the website, I was doing a small refactor to the part of the code that loads in all the files into an index of sorts. Here's the python code, the important thing to note here is the first line declaring a map, and then the near to last line where we just set a flag:
known_files_tracker = {}
def plugin_loaded():
    for window in sublime.windows():
        for folder in window.folders():
            add_files_to_suggestions(folder)
    sublime.status_message("HrefHelper context loaded")

def add_files_to_suggestions(folder):
    for root, dirs, filenames in os.walk(folder):
        for handle in filenames:
            full_path = os.path.join(root, handle)
            # Skip if we know about this already
            if full_path in known_files_tracker:
                continue

            relative = os.path.relpath(full_path, folder)
            file_href_path = relative.replace("\\", "/")

            # We could make this a setting for the plugin
            if file_href_path[0] != ".":
                href_files.append(completion_for(handle, file_href_path))
                href_files.append(completion_for(file_href_path, file_href_path))
                known_files_tracker[full_path] = 0
    sublime.status_message(f"Loaded {folder} to href context")
To quote myself:
All i've done is created add_files_to_suggestions and added in a hashmap from the
absolute path on the operating system to a flag value. I'm curious if this will take up a lot
of memory, and the premature optimization part of my brain wants to break it by the path separator
and push each part into a Trie, but I'll hold back for now. Since I haven't actually done the math
to see if that would actually reduce the memory we're using.
And, despite saying I'd hold back. It didn't take long before that itch in the back of my brain successfully nerd sniped me and I swapped over to a Trie. Tries are just a lot of fun, not to mention super useful! I used one during advent of code as well as in my recent word puzzle game, and it feels like they keep popping up in my life randomly. So, to get another chance to fool around with one? You know I had to.
Before we get to the details and go over the implementation though, let's talk a bit more on the why here. In the above code, the goal was to keep track of files that had been loaded into our list of autocomplete options. The reason for this being that Sublime Text doesn't offer an easy way to detect when a new folder has been added to the current project. No new folder hook? No new files in that folder indexed. No autocomplete. But, sublime does offer us a way to detect when a user clicks into a file and opens it in the editor. So...
- User clicks into a file
- If we know we've already indexed this file, stop.
- Else check the path of the folders that are open right now and compare to the path of the file
- If this file we're in is inside of a folder, then go ahead and re-index it.
Since our add_files_to_suggestions will skip over any files we've indexed already, this handles
both the "new file in an existing folder" case, as well as "brand new folder" case in one go, which is kind
of nice. But obviously, this comes at a cost. Memory. How do reclaim that memory back?
The Trie ↩
If you're unfamiliar with what a Trie is, the simplest explanation is that you've got nodes connected to other nodes
like a usual tree data structure, but with the data on the edge rather than in the node. In a "normal"
tree or graph, you have a node and then it has a pointer to some other node
and if you were to jump over to that node, you'd be able to inspect its value and see that it is foo
. Think flow charts, it's not a Tree with a root, but it illustrates how one generally thinks:
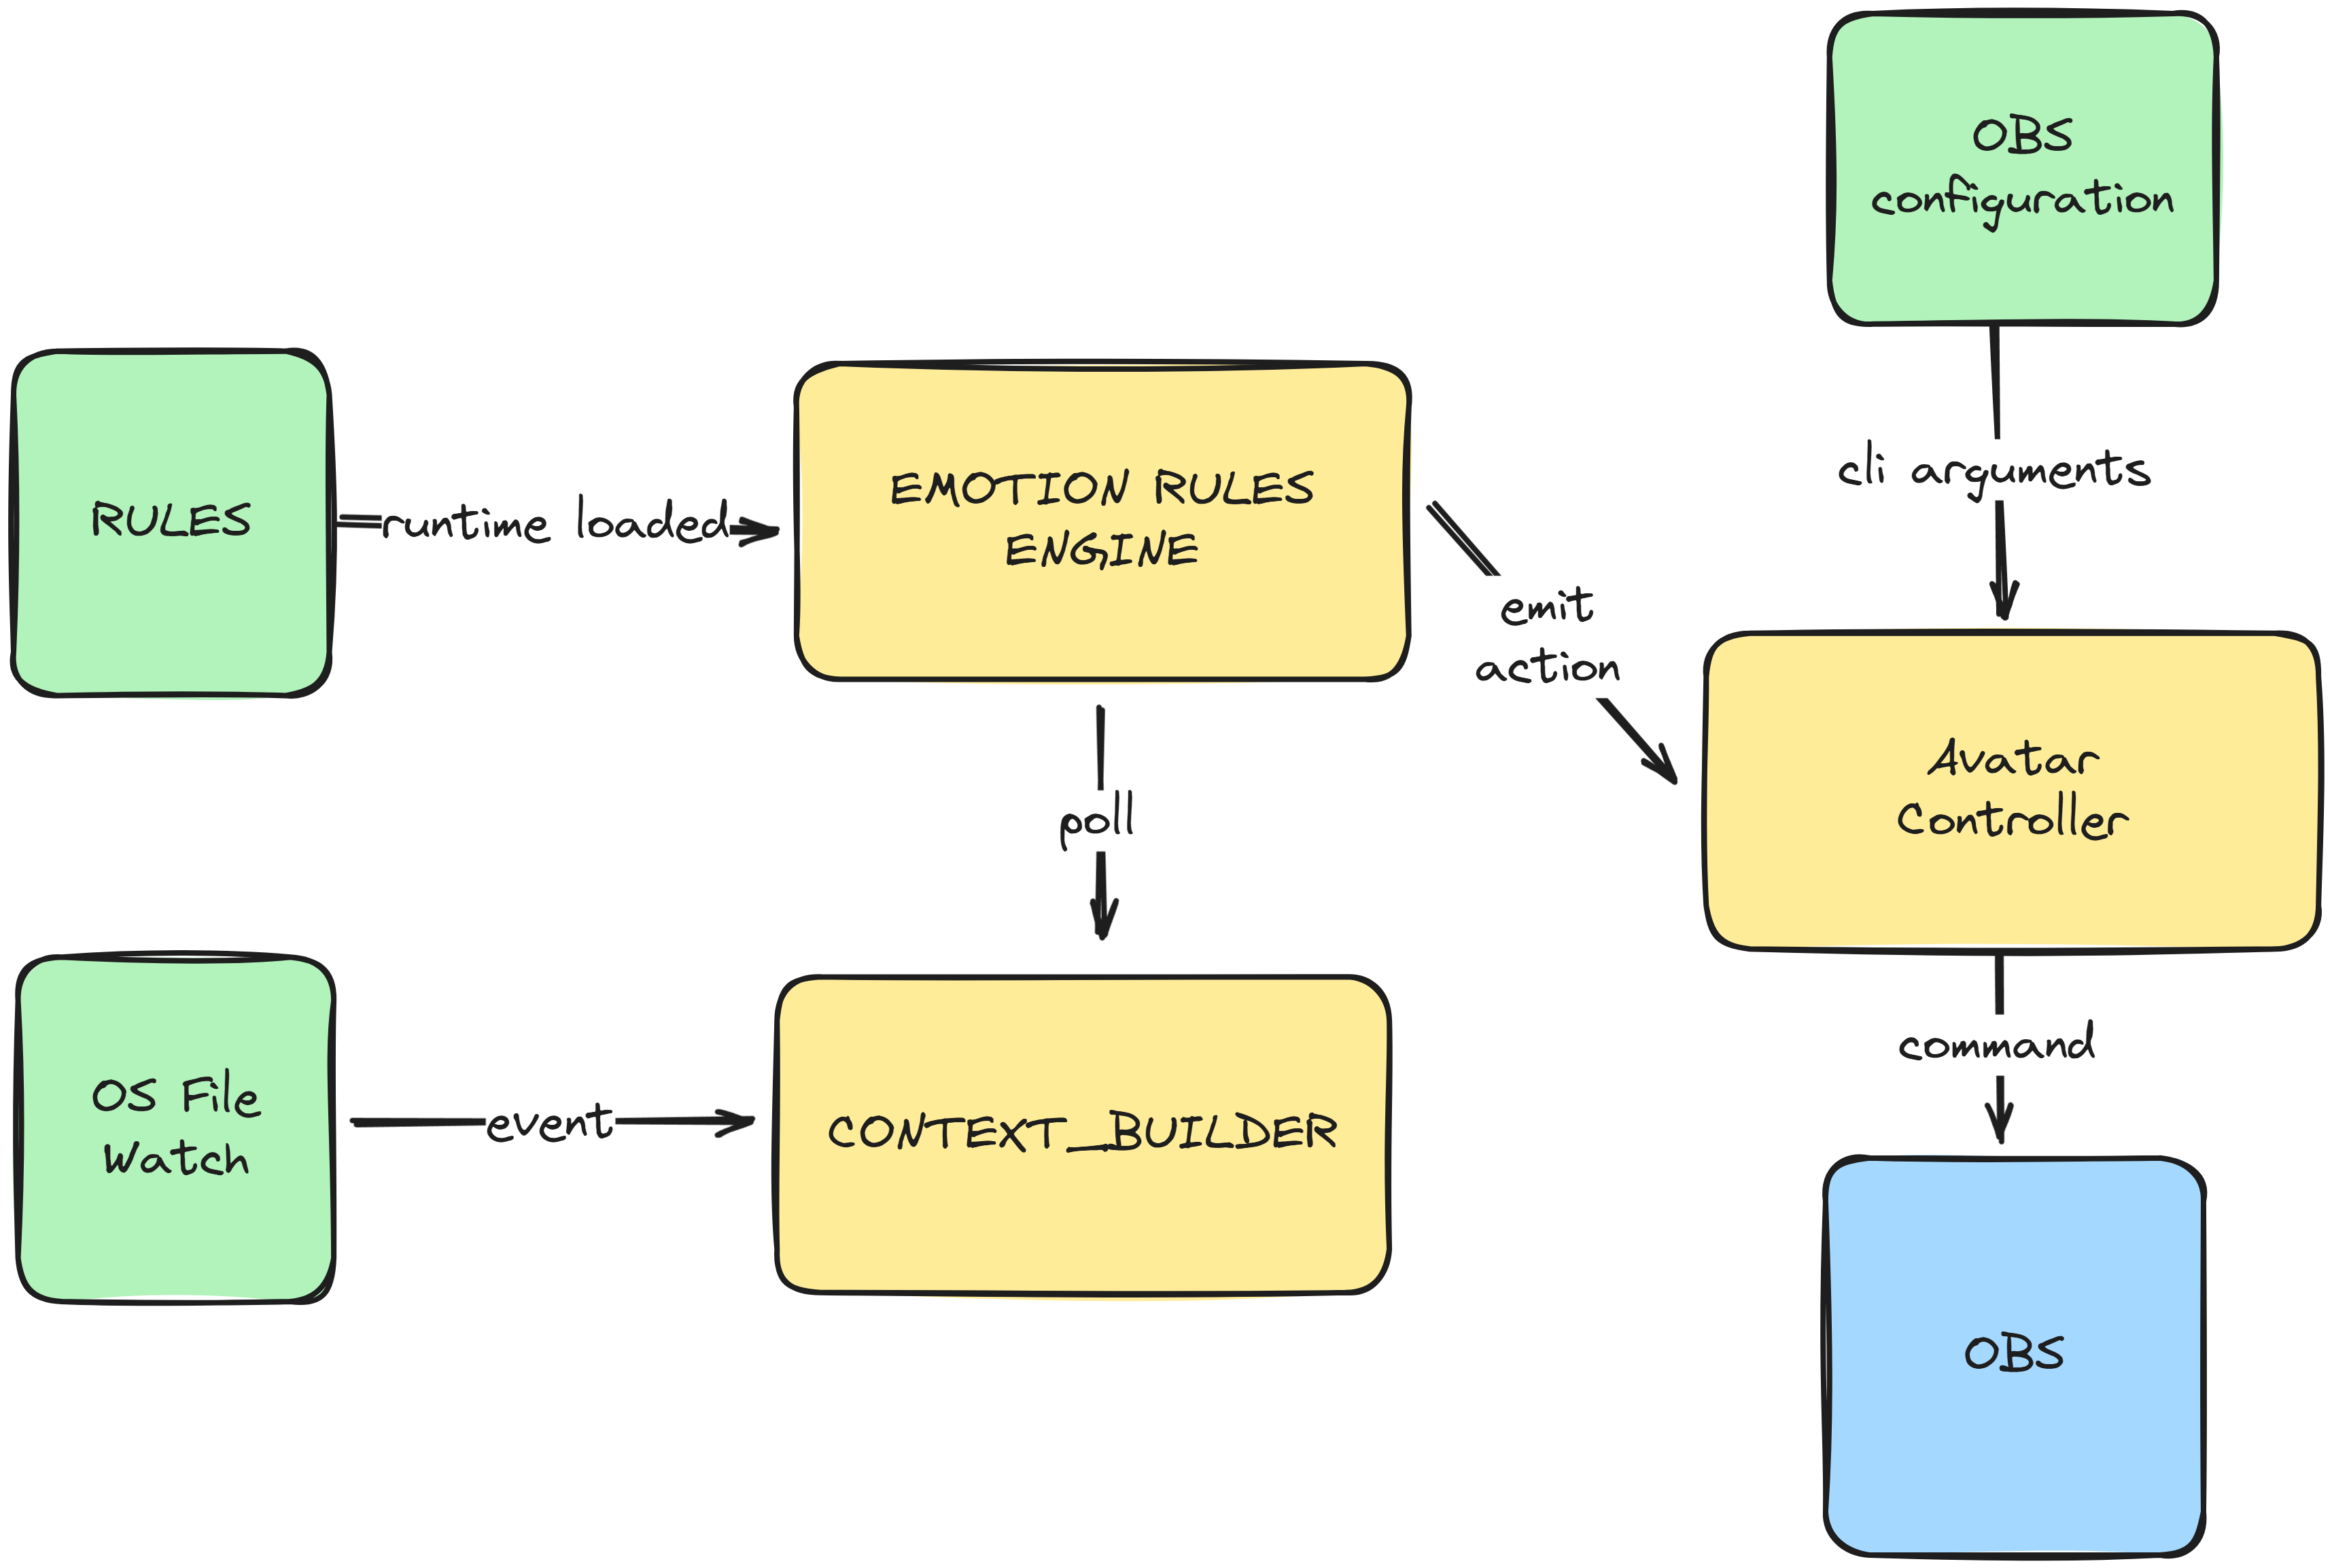
A Trie moves the data from inside the node, onto the edges connecting the nodes:
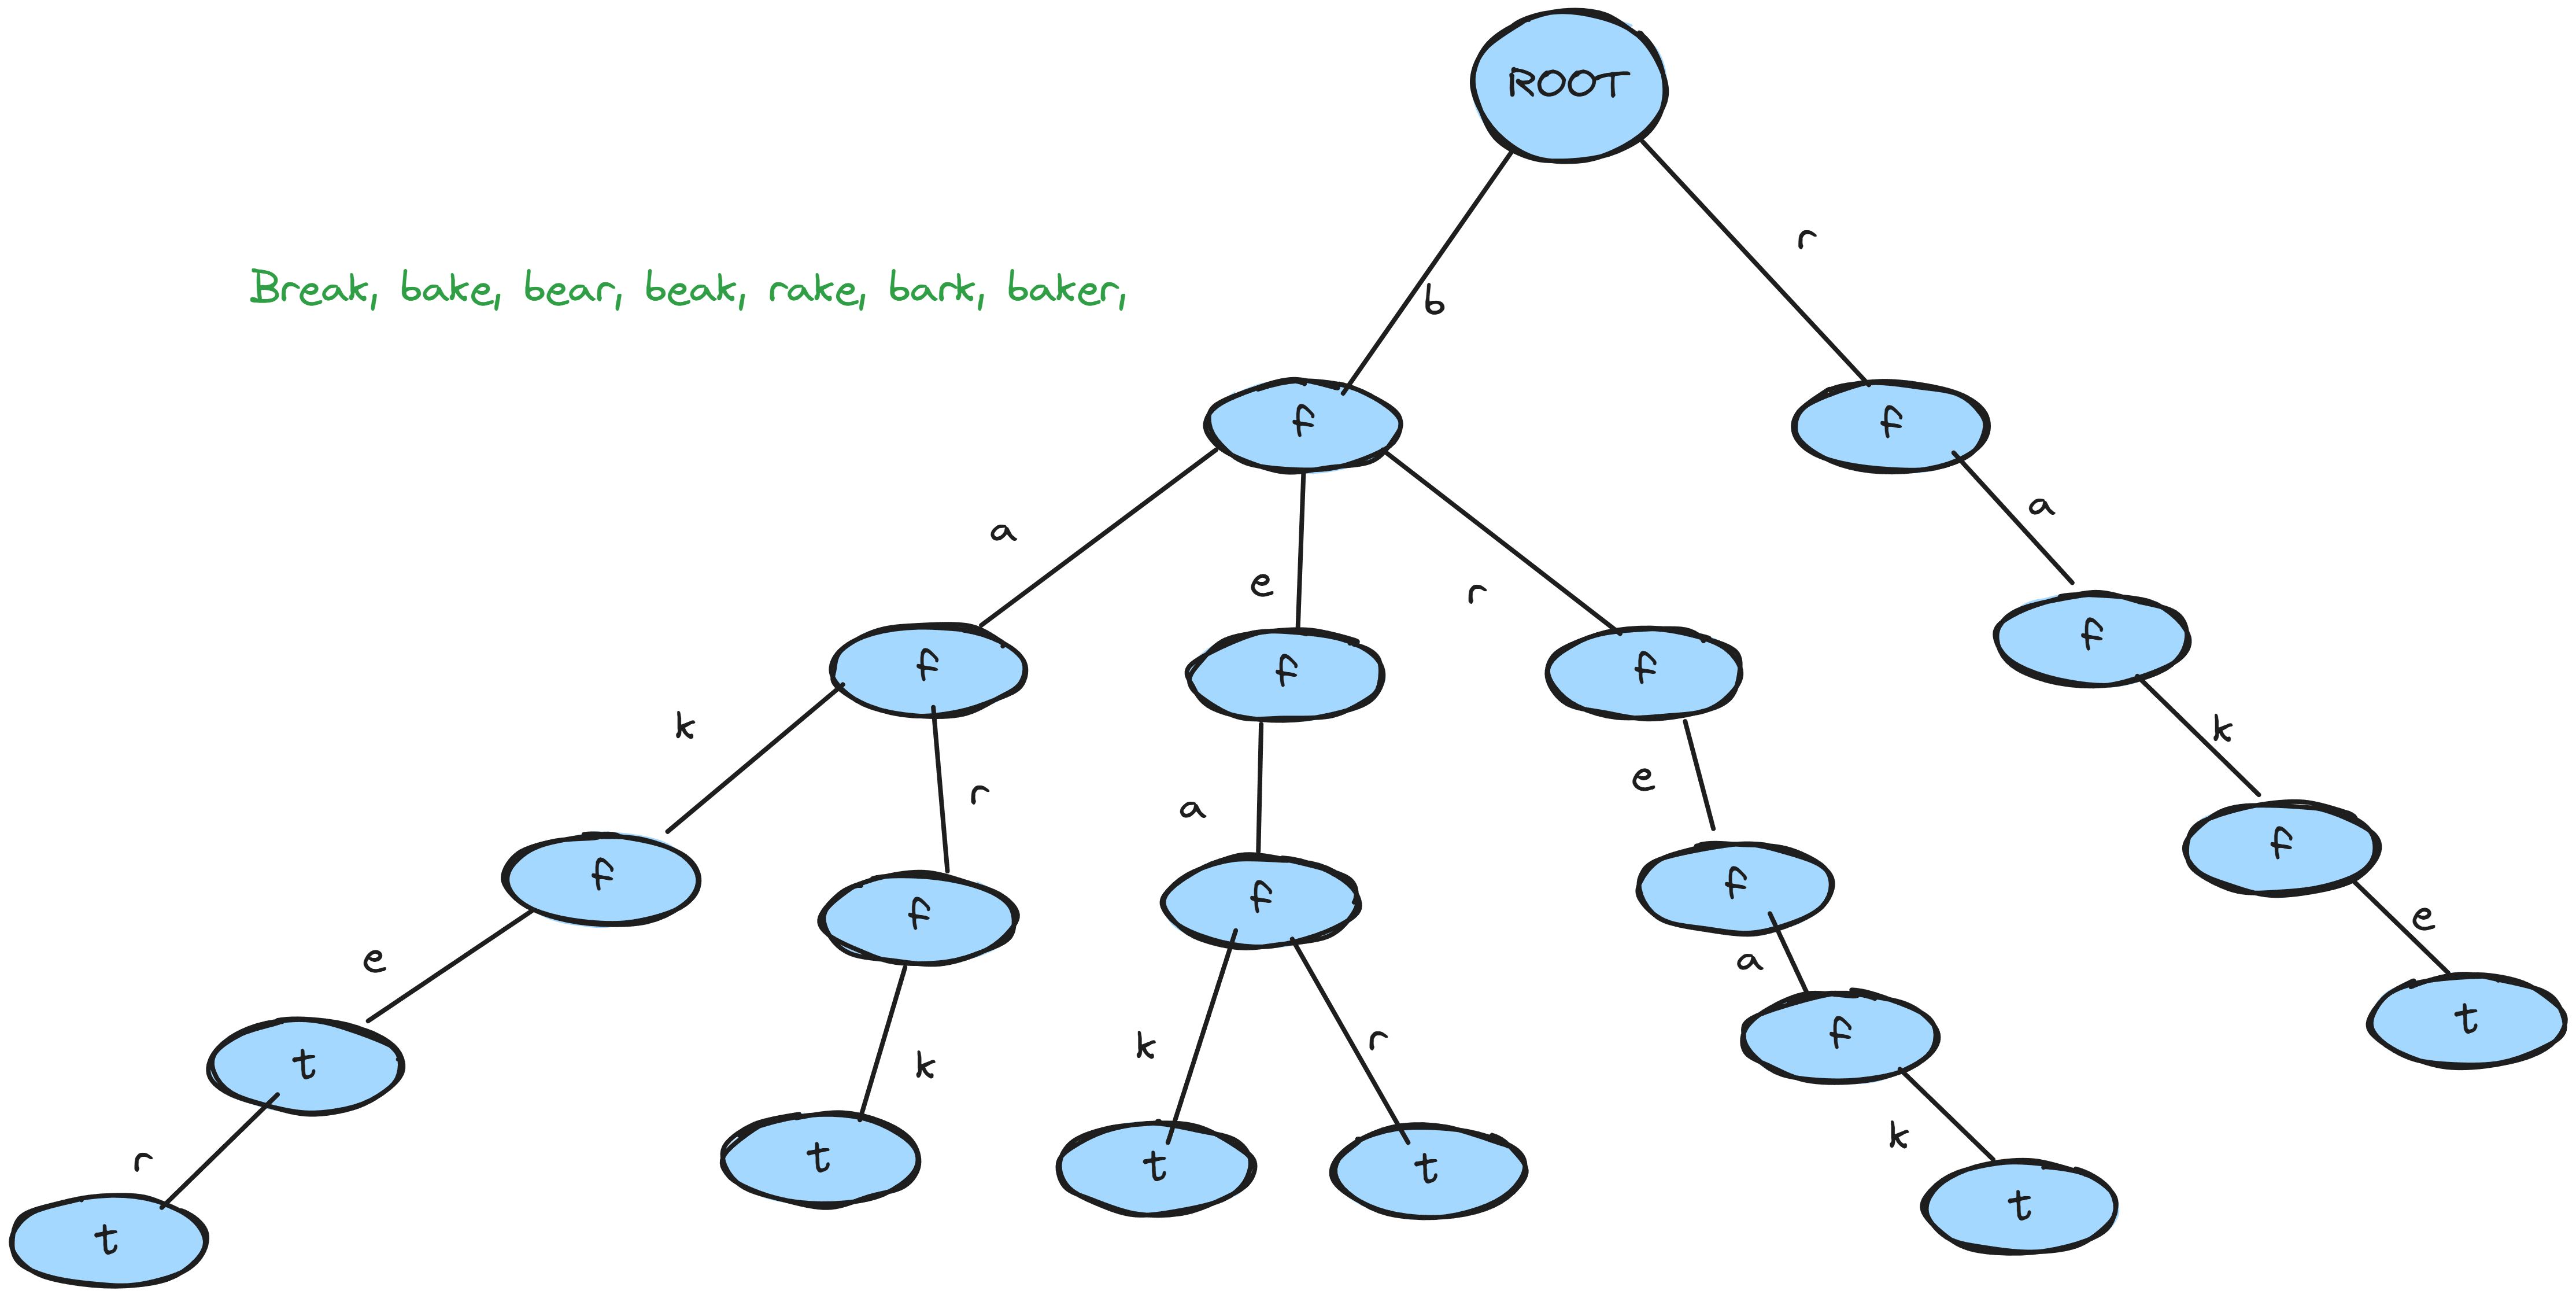
The above example is storing words, character by character. and so this results in a very fast lookup that is often used in drumroll autocomplete software. It's surprising how powerful this can be! We're not tied to just using characters like in the typical example. There is literally no reason why you can't use larger chunks of data as the edge. And so, consider this:
class PathTrieNode:
    def __init__(self):
        self.children = {}
        self.is_end_of_path = False

class PathTrie:
    def __init__(self):
        self.root = PathTrieNode()
        self.seperator = os.sep

    def insert(self, path):
        node = self.root
        parts = path.split(self.seperator)
        for path_part in parts:
            node = node.children.setdefault(path_part, PathTrieNode())
        node.is_end_of_path = True

    def contains(self, path):
        node = self.root
        parts = path.split(self.seperator)
        for path_part in parts:
            if path_part in node.children:
                node = node.children[path_part]
            else:
                return False
        return node.is_end_of_path
The one bit of explanation that I didn't note before is that each note does store a piece of data. Specifically, it stores whether or not the node itself is a terminal. Meaning that in the case of a word, something like "batman" would have a terminal node at t and n because you can see there is a word "b a t" but also that t has children and can be extended to the word batman by following t's children until you hit a terminal.
The one thing I'll point out in the python code is the usage of setdefault on the
children field. This is just shorthand for "set the key at path_part to a new node
if it doesn't exist or return the thing that does". When we iterate over the parts, piece by
piece, we're walking down along the path:
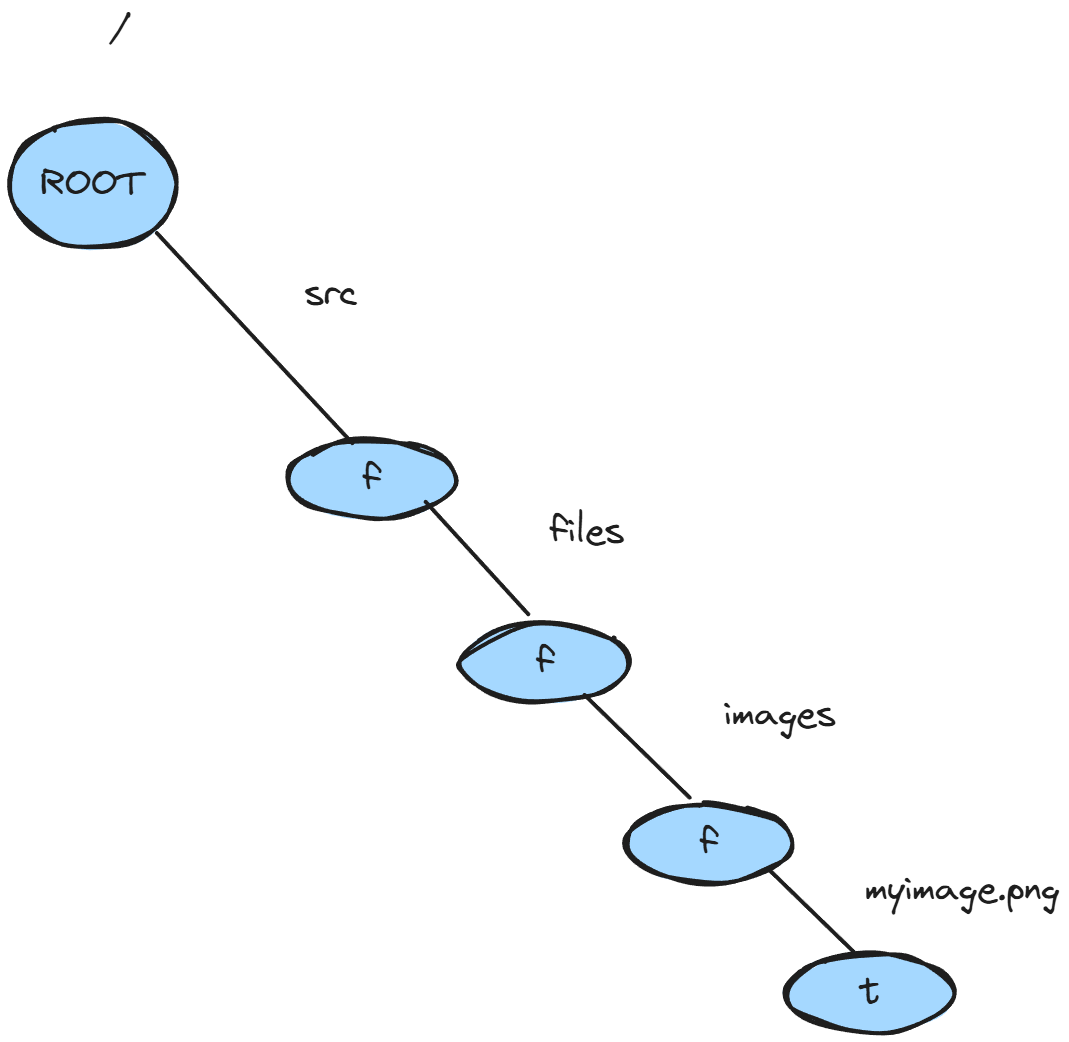
and so this makes it easy to set the child up if it doesn't exist already. It's certainly a bit more terse and readable if you're used to it than something like
if path_part in node.children:
    node = node.children[path_part]
else:
    node.children[path_part] = PathTrieNode()
    node = node.children[path_part]
And so it makes the iterative walk pretty quick and easy when we're inserting to stretch and extend our tree out a bit. Meanwhile, the contains method is effectively the same thing but we just bail out if we run out of road or the place we end up in doesn't denote a terminal. Which in our world means that you hit on the file name in the path you provided and your file does in fact exist in the Trie already.
Neat right? Now, hooking this up to sublime is a little tricky, but that's what we did in in the last post so I won't go over it here. But what I do want to talk about is how big of an impact this has on our plugins overhead.
Measuring our success ↩
I'll hold back for now. Since I haven't actually done the math to see if that would actually reduce the memory we're using.
Me - last blog post
Let's do that math now. I already noticed an imperical amount of success, in the task manager in windows, but that's not really hard evidence since it's tricky to say if the memory is in use or not. Like, if I run the plugin with the naive way first like this:
def add_files_to_suggestions(folder):
    for root, dirs, filenames in os.walk(folder):
        for handle in filenames:
            full_path = os.path.join(root, handle)
            # Skip if we know about this already
            if full_path in known_files_tracker:
                continue

            relative = os.path.relpath(full_path, folder)
            file_href_path = relative.replace(os.sep, "/")

            # We could make this a setting for the plugin
            if file_href_path[0] != ".":
                href_files.append(completion_for(handle, file_href_path))
                href_files.append(completion_for(file_href_path, file_href_path))
                known_files_tracker[full_path] = 0
    sublime.status_message(f"Loaded {folder} to href context")
And then with the Trie, and check on the memory in use, the application might still have as much memory as before since the OS might just not have reclaimed it yet. We could try to track this with something like tracemalloc:
def memoryusage(func):
    @wraps(func)
    def wrap(*args, **kw):
        if ENABLE_MEM_COUNT:
            tracemalloc.start()
            (current_start, peak_1) = tracemalloc.get_traced_memory()
        result = func(*args, **kw)
        if ENABLE_MEM_COUNT:
            (curent_end, peak_2) = tracemalloc.get_traced_memory()
            tracemalloc.stop()
            info = f"{func.__name__}({args}, {kw}) start:{current_start} stop:{curent_end} peaks: {peak_1} {peak_2}"
            print(info)

        return result
    return wrap
Then annotate the function and look at the results like:
add_files_to_suggestions(('\\Personal\\peetseater.space',), {}) start:0 stop:1031830 peaks: 0 1036362
Then that maybe could tell us. We could also construct the whole shebang and then check the size of it recursively. Since I'm interesting in the amount of memory being used by the system, this is actually what I want since the advantage of the Trie is that it gets to share the same memory for each shared part of a path and therefore use less memory to represent things the plain hash or set would have to duplicate.
import sys

def total_size(obj, seen=None):
    """Recursively calculate total memory size of an object and its contents."""
    size = sys.getsizeof(obj)
    if seen is None:
        seen = set()
    obj_id = id(obj)
    if obj_id in seen:
        return 0
    seen.add(obj_id)

    if isinstance(obj, dict):
        size += sum(total_size(k, seen) + total_size(v, seen) for k, v in obj.items())
    elif isinstance(obj, (list, tuple, set)):
        size += sum(total_size(i, seen) for i in obj)
    return size
There's an interesting blog post here
about how you often don't want to use sys.getsizeof, but in our case we do. I want to know
how much total memory sublime is going to be using to represent our data structure under the hood, which means that if
python is doing some handy re-use of code, then I want to be sure that's represented!
Interestingly enough, the first time I ran this I saw this when I compared the Trie vs the map:
simple: 386163 vs trie 48
Which was obviously wrong. So then I added in the attribute for the __dict__ and
__slots__ to the sizing function like this
elif hasattr(obj, "__dict__"):
    size += total_size(obj.__dict__, seen)
elif hasattr(obj, "__slots__"):
    size += sum(total_size(getattr(obj, slot), seen) for slot in obj.__slots__ if hasattr(obj, slot))
And that helped out and got me
simple: 386163 vs trie 784773
But wait! That looks a lot like the trie is losing! Let's help it by declaring __slots__
which the documentation states
can result in significant savings since we'll reserve space for the fields explicitly rather than let
python create a dictionary for them.
class PathTrieNode:
    __slots__ = ("children", "is_end_of_path")
    def __init__(self):
        self.children = {}
        self.is_end_of_path = False
This then results in
simple: 386163 vs trie 535777
Which is pretty neat that we just got a 34% savings in memory. But the full unique strings are somehow still winning! If we ask python to intern the strings we should see some savings from potentially having those strings get shared in memory:
def insert(self, path):
    node = self.root
    parts = path.split(os.sep)
    for path_part in parts:
        part = sys.intern(path_part)
        node = node.children.setdefault(part, PathTrieNode())
    node.is_end_of_path = True
And then I got this result:
simple: 386163 vs trie 523578.
We've improved it, but it's still really surprising! When I first whipped this stuff up, I had witnessed savings in the task manager! So, why is it that now that I'm trying to observe this more closely and get to byte counting that it seems like I've somehow been lying to myself? How many paths are we counting here anyway that we're not getting significant savings from how many shared folder paths there are?
2227 is the number of files opened by editor right now with my website, the reference files from the last blogpost, my raylib code, the raylib library, and my rust code for my duplicate file detector. How many nodes does it take for us to store that I wonder? And what's our deepest path?
num_nodes = 0
max_depth = 0

class PathTrieNode:
    __slots__ = ("children", "is_end_of_path")
    def __init__(self):
        self.children = {}
        self.is_end_of_path = False
        global num_nodes
        num_nodes += 1

class PathTrie:
    def __init__(self):
        self.root = PathTrieNode()

    def insert(self, path):
        node = self.root
        parts = path.split(os.sep)
        global max_depth
        if len(parts) > max_depth:
            max_depth = len(parts)
        for path_part in parts:
            part = sys.intern(path_part)
            node = node.children.setdefault(part, PathTrieNode())
        node.is_end_of_path = True
Printing this out alongside our other states shows me:
len of simple: 2227
simple: 386313 vs trie 523751
num_nodes: 22915 max_depth: 16
Well then. That's a lot of overhead. If we take the average path depth (by dividing the numbers of nodes by the length of the dict) we can see it's around 10 or so. So That means we're sharing a good amount of prefixs! Which is great! But... still. If each node in our Trie is carrying around additional baggage from its internal dict for the children, as well as the other bytes for the flag and the string keys for each kid. Then that's going to start adding up to more than just having the plain old strings themselves.
Confusingly, if I graph synthetic data, it shows off that the Trie actually should start winning around this point:
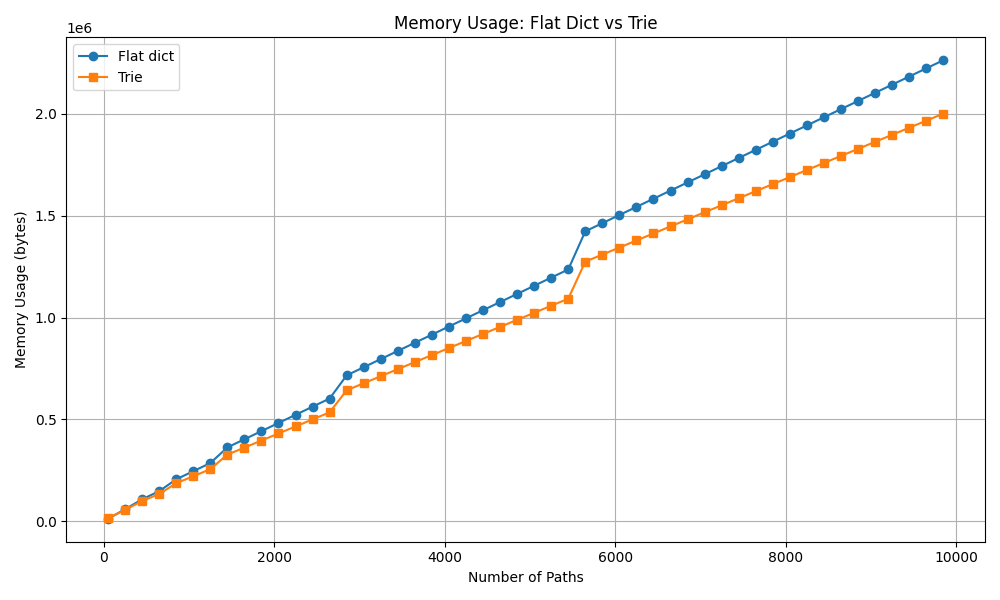
But this synthetic data was generated like this
def generate_paths(count, shared_prefix_parts=3):
    """Generate synthetic paths with tunable prefix sharing."""
    paths = []
    shared = [f"directory{i}" for i in range(shared_prefix_parts)]
    for i in range(count):
        unique_part = f"file{i}.txt"
        full_path = os.sep + os.sep.join(shared + [unique_part])
        paths.append(full_path)
    return paths
Which, intuitively favors the Trie case since we can tweak and tune the shared prefix to longer and longer lengths. But this sort of begs the question, what does our real data skew towards and look like? I think that we can get an idea about this by thinking about the fan out of the nodes. If we track the depth of each individual node then plot that a bit.
Starting with our synthetic data (because I want to make sure I've got things right) I'll just use global variables for simplicity
global fanout_counts, depth_counts
fanout_counts = []
depth_counts = []
def collect_trie_stats(node, depth=0):
    fanout_counts.append(len(node.children))
    depth_counts.append(depth)
    for child in node.children.values():
        collect_trie_stats(child, depth + 1)
Then plotting these out with matplotlib
def plot_trie_stats():
   plt.figure(figsize=(14, 5))

   # Fanout histogram
   plt.subplot(1, 2, 1)
   plt.hist(fanout_counts, bins=range(0, max(fanout_counts) + 2), edgecolor="black")
   plt.title("Trie Node Fanout")
   plt.xlabel("Number of Children")
   plt.ylabel("Number of Nodes")

   # Depth histogram
   plt.subplot(1, 2, 2)
   plt.hist(depth_counts, bins=range(0, max(depth_counts) + 2), edgecolor="black")
   plt.title("Trie Node Depths")
   plt.xlabel("Depth")
   plt.ylabel("Number of Nodes")

   plt.tight_layout()
   plt.show()
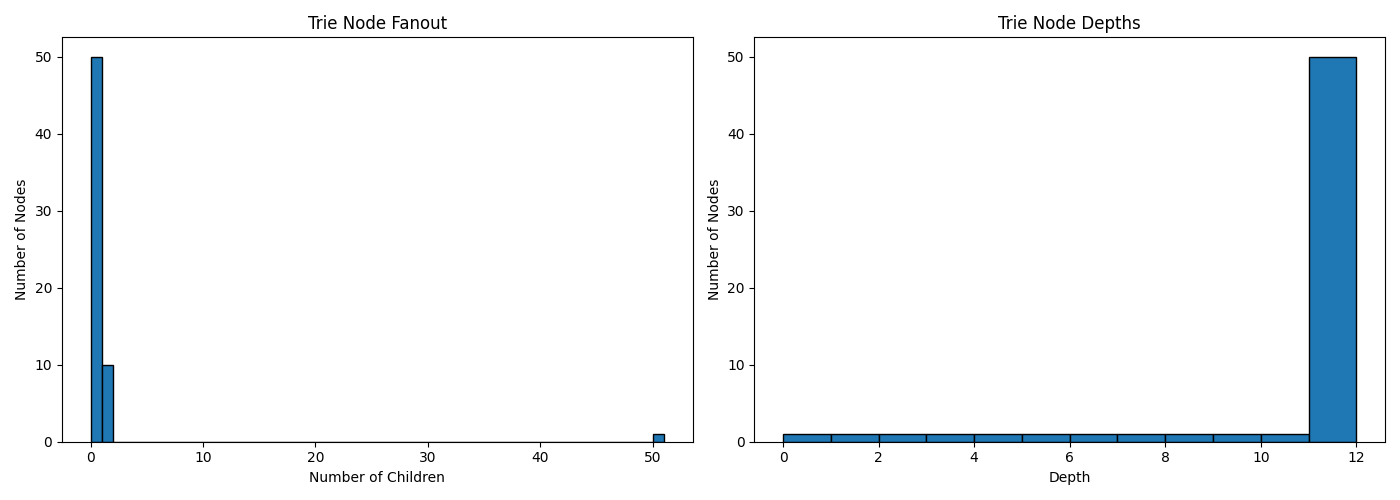
This shows us what we expect for the synthetic data since it's sharing one giant long prefix and then just has terminals at the end with the filenames. So you end up with a lot of nodes with singular children and then a bunch at the end with one big point of fanout. This plot was using 50 paths to make it easy to see in the numbers, but even if I increase the number the pattern will be the same.
So what about the folders I currently have open in sublime?
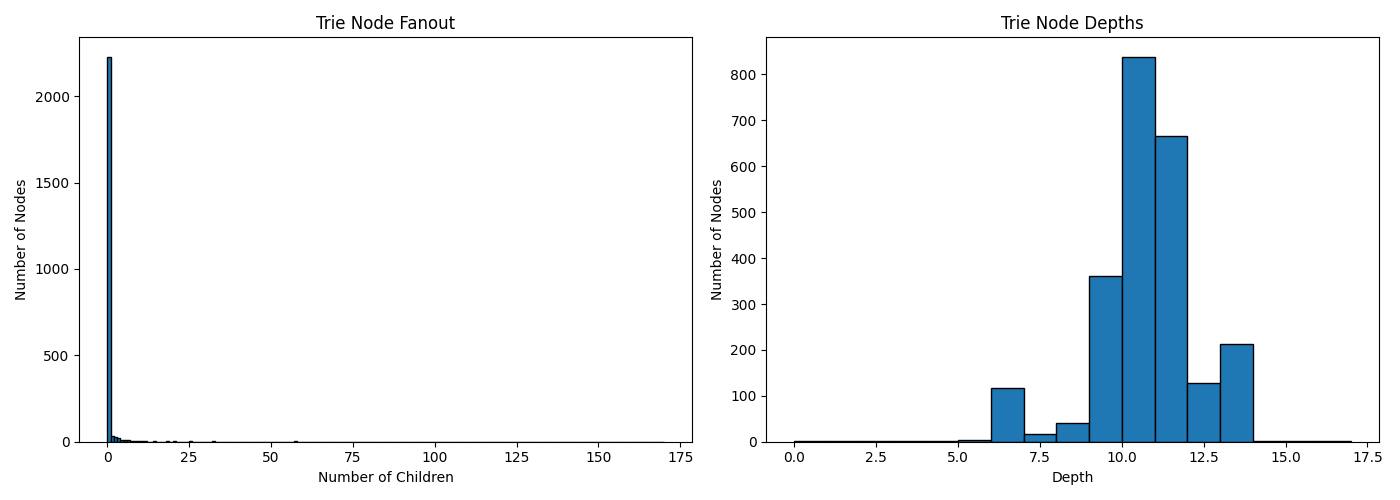
Well then, we see our average depth of 10 reflected here which means we're doing this right. But, the scale of the number of nodes with a single child is making it a bit tough to see the fanout on the left graph. Or rather, the fanout is pretty much always 1. Which tells us that a lot of our file paths are sharing a very long chain of singular nodes before they land on a folder that has a bunch of files in it. Most of which, as we can see by the second graph, have children or subfolders branching out around 10 - 11 layers deep.
I think this helps explain why the simple hash is beating the Trie. Each level of the trie,
even with our optimizations of __slots__ and friends is still maintaining some
level of overhead, and if there are 2000+ nodes with a single child, then that's 2000+ nodes
that are probably bigger than a simple "directorypath" part of the string in total, even if
we have a bunch of strings like: "/1/2/3/4/5/6/7/8/9/10/file.png" the cost of
having /node/node/node/node/node/node/node/node/node/node/node (terminal) weighs
more.
The thing that still doesn't make sense to me is that, based on my intuition of how this should be working on a conceptional level, all those nodes for the first 5 or so levels should be shared between their child paths, and so we should see some degree of memory savings that should potentially beat the simple strings, right?
If I tweak my y-axis scale to try to examine the fanout a bit more closely since our scale difference is so big, we get this plot:
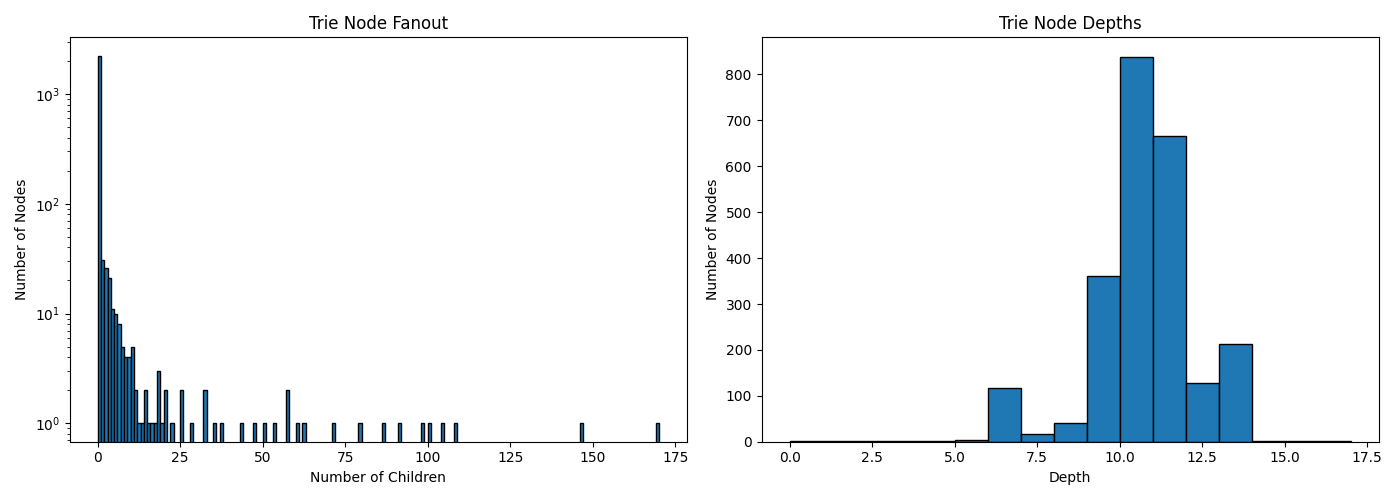
Does this line up with my intuition at all? Most of the folders I have open are prefixed by
C:\Users\User\Documents\Code\Somedir\ and so I would expect that at around depth 6,
that I'd see a fan out matching the number folders I have open right now. And yes, we see a small bump
in the depth graph around 6. So it is working as I'd think it is, but... the cost of
overhead for our objects is just too big and so the plain dict beats us.
So... if it's python's overhead that's making us use more memory... what about the difference between
python's Set versus this hashmap then? If I'm not trying to break up the path anymore
because it simply doesn't buy us anything useful, then which of the built in ways to track this sort
of data outperforms the other?
known_files_tracker = PathTrie()
sizesimple = {}
simpleset = set()

def plugin_loaded():
    for window in sublime.windows():
        for folder in window.folders():
            add_files_to_suggestions(folder)
    sublime.status_message("HrefHelper context loaded")
    size_of_simple = total_size(sizesimple)
    size_of_trie = total_size(known_files_tracker)
    size_of_set = total_size(simpleset)
    print(f"len of simple: {len(sizesimple)}")
    print(f"simple: {size_of_simple} vs trie {size_of_trie} vs set {size_of_set}")
    print(f"num_nodes: {num_nodes} max_depth: {max_depth}")

def add_files_to_suggestions(folder):
    ...
            if file_href_path[0] != ".":
                ...
                known_files_tracker.insert(full_path)
                sizesimple[full_path] = 0
                simpleset.add(full_path)
And one last load of the plugin gets us...
simple: 387131 vs trie 524708 vs set 444579

Now hold on a minute. You're telling me that the first, stupid simple "lets just use a dict with a useless value" method is also more performant on memory than the freaking built in set for this use case? Hold on, what if we just do some silly dummy value stuff, is this true in general?
import sys

d = {f"file_{i}": 0 for i in range(10_000)}
s = {f"file_{i}" for i in range(10_000)}

print("dict size:", sys.getsizeof(d))
print("set size:", sys.getsizeof(s))
dict size: 295000
set size: 524504
Welcome to the world of, what the heck do you mean. How is it that storing a bunch of keys AND a value (shared or not) is somehow more memory-optimized than only having keys? Python you wacky snake, what are you doing underneath the hood here?!
The dictionary source code gets at the heart of it it seems. Back in 2012 there was a major optimization done to the dictionary's internals which is described here, I'll quote a bit for you:
For example, the dictionary:

    d = {'timmy': 'red', 'barry': 'green', 'guido': 'blue'}

is currently stored as:

    entries = [['--', '--', '--'],
               [-8522787127447073495, 'barry', 'green'],
               ['--', '--', '--'],
               ['--', '--', '--'],
               ['--', '--', '--'],
               [-9092791511155847987, 'timmy', 'red'],
               ['--', '--', '--'],
               [-6480567542315338377, 'guido', 'blue']]

Instead, the data should be organized as follows:

    indices =  [None, 1, None, None, None, 0, None, 2]
    entries =  [[-9092791511155847987, 'timmy', 'red'],
                [-8522787127447073495, 'barry', 'green'],
                [-6480567542315338377, 'guido', 'blue']]
The memory savings are significant (from 30% to 95% compression depending on the how full the table is). Small dicts (size 0, 1, or 2) get the most benefit.
Ok. So, this explains why dicts are good with memory, but why are sets bad? The C struct that is that set shows us that we've got a table that's always a fixed size for small tables (< 8 entries) or a malloced one for larger. So our table would be using one giant slab of memory from the OS. The size of which is going to be big enough to store the key (our full path) and a hash of it (which is just the size of a pointer it seems)
typedef struct {
    PyObject *key;
    Py_hash_t hash;  /* Cached hash code of the key */
} setentry;
How do we set the size of this giant slab of memory? Well, it's going to start at 8 when it's using a "smalltable", and then grow. And when it grows:
/* Find the smallest table size > minused. */
/* XXX speed-up with intrinsics */
size_t newsize = PySet_MINSIZE;
while (newsize <= (size_t)minused) {
    newsize <<= 1; // The largest possible value is PY_SSIZE_T_MAX + 1.
}
source
Shifting bits to the left by one is just another way to multiply a number by 2 quickly. So, our set's size is going to grow from 8, to 64, to 128, etc until it has enough room. So there's no packing or tight memory like the dict has going for it because the Set is just storing a basic list. And if you think about us having over 2048 things, we're going to end up with a slab of memory of at least 4098 * the size of the entry struct. Which means that there's thousands of empty slots in memory that are uncompacted and unused!
When a dict is created and inserted into for the first time,
there's a special case
and the keys list is made via PyDictKeysObject *newkeys = new_keys_object(interp, PyDict_LOG_MINSIZE, unicode);,
that PyDict_LOG_MINSIZE is defined as 3 right now. The new_keys_object method is
what actually allocates our memory, and does so (assuming it doesn't have some free dictionary sized memory
hanging around to be re-used) by doing this:
dk = PyMem_Malloc(sizeof(PyDictKeysObject)
 + ((size_t)1 << log2_bytes)
 + entry_size * usable);
So that's 8 (since we shifted 1 over 3 times) and useable is defined by
usable = USABLE_FRACTION((size_t)1<<log2_size);
Which is a macro that just takes 2/3's of the value.
#define USABLE_FRACTION(n) (((n) << 1)/3)
So, for 3, that's 3 * 2 / 3 = 2, times how big the actual structs are... inspection of the regular insertion code
and the way resize works, led me over to the GROWTH_RATE macro, which I wish I had found before
tracing that code I just mentioned, since it has a helpful comment that clears things up:
/* GROWTH_RATE. Growth rate upon hitting maximum load.
 * Currently set to used*3.
 * This means that dicts double in size when growing without deletions,
 * but have more head room when the number of deletions is on a par with the
 * number of insertions.  See also bpo-17563 and bpo-33205.
 *
 * GROWTH_RATE was set to used*4 up to version 3.2.
 * GROWTH_RATE was set to used*2 in version 3.3.0
 * GROWTH_RATE was set to used*2 + capacity/2 in 3.4.0-3.6.0.
 */
#define GROWTH_RATE(d) ((d)->ma_used*3)
source
So. That's pretty clear. So 8 plus an entry size times 2 to start and alright, and wait did that just say "They double in size each time"? Wait. Wait wait wait.

BUT THAT'S THE SAME RATE AS THE SET
Clearly, trying to wander around in an unfamiliar codebase is not helping me understand why I see what I see in here. If both set and dict grow their keys at the same rate, then why is it that set is larger and dict is smaller? Like, yes, these are two different data structures and have different structs. But... the set's entries (the only dynamic thing about the overall object) is just this tiny bit of pointer and hash:
typedef struct {
    PyObject *key;
    Py_hash_t hash;
} setentry;
source
meanwhile the dict wrapper object has these things broken out into _dictkeysobject and _dictvalues:
struct _dictkeysobject {
    Py_ssize_t dk_refcnt;
    uint8_t dk_log2_size;
    uint8_t dk_log2_index_bytes;
    uint8_t dk_kind;
    uint32_t dk_version;
    Py_ssize_t dk_usable;
    Py_ssize_t dk_nentries;
    char dk_indices[];
}
source

struct _dictvalues {
    uint8_t capacity;
    uint8_t size;
    uint8_t embedded;
    uint8_t valid;
    PyObject *values[1];
};
source
And somehow you're telling me that a growable list, growing at the same rate, for the first snippet is larger than a list growing at the same rate for the second? This is... weird. Very weird. And I've spent a number of hours staring at this and trying to make sense of the terribly named1 variables inside of this c code to no avail. So... let's take a step back. We're not here to try to understand why dict and set don't seem to align with our intuition, but rather, just understand that the native dict is going to outperform our custom made trie in memory usage. And we get that, the python mailing list explains how dicts have been optimized, and our object in python code is never going to beat the raw performance of the c python code.
Wrapping up ↩
Deep breaths.

Putting aside that nerdsnipe at the end, let's talk about the good things we've learned today!
First off, we found out that my one time observation of 50MB to 20MB was in fact, a one time observation that must have had something to do with radiation or neutrinos from some supernova millions of miles away because in all our benchmarking and fiddling, it never happened again and we found out that if we want memory performance, we need to use built in types.
Secondly, and well. I guess this is kind of in that last sentence, but I think it's worth repeating: measuring the actual performance of something can show that a theoritical idea and concept that seems better at first can actually perform worse! Pre-mature optimization is the root of all evil and all that, and this was a lovely example of that.
So we've learned that if you want to optimize memory in python you should just write C, because there's no way in hell (even with __slots__) that you're going to beat the amount of time and effort pushed into the dict implementation in CPython with a fancy pants Trie like the one I threw together. Could a Radix tree beat it? Maybe! But I would hazard a guess 2 that the simple dict would beat it too.
Tries are still really cool, so while I'm sad that I'll probably swap back to basic dicts for my plugin to keep things low-cost, I think it was still very much worth the journey we took together! It's fun to dig in and measure things, looking at performance characteristics of real data versus synthetic and seeing how the armchair case falls short of cold hard reality is neat.
I hope this was interesting to you all, even if I feel like I fell short of a satisfying conclusion in regards to the C code in the python language. My next blog post will probably be another python one, though not looking at any of this C stuff! I think there's still a few more optimizations I can do for my workflow with writing HTML for these blogposts to completely replace VS Code and I actually implemented one while working through all of this! I'll tell you all about it in the next post!
